Scaling a toy project about time perception from 0 to 80k requests in a day.
Jinay Jain - Nov 29, 2021
If you’re curious to see how well you can estimate a minute, try out Just a Minute for yourself (and the source code).
Late last year, I was brainstorming ideas with my team for a hackathon project that could be made in less than 24 hours. One such idea I had was to build a web experiment that tests how people perceive time. In hindsight, the idea was so simple that it would be overkill to use a team of 4 people to build it in 24 hours. We ended up pursuing a different, more technically complex project, but I still kept my original idea in mind.
A few weeks later, I had some spare time and wanted to build a quick weekend project, so I went back to that hackathon idea and built a simple page that asked users to estimate how long a minute is. I deployed it to GitHub Pages and shared it with a few close friends to try out. All in all, the implementation took less than a day to complete.
And that was it—I left the website up and moved on to my next project.
The Revival
After a year of no updates, I decided to revisit the site and add another feature: a live histogram of estimates as they came in. To avoid the hassle of setting up my own backend server, I used the Firebase Realtime Database as a quick solution to store the data. This would allow me to do simple reads and writes to the database without having to write a custom server API. The per-GB pricing for Firebase was comparatively expensive to other options—but I was never going to exceed the free tier limits, right?
Every time someone completed an attempt, I would write a new entry with their time to the database. The database would return all times back to the client, which I then used to build a histogram with the Chart.js library. Computing the histogram values was all done on the client, so the database’s only responsibility was to store the data and return it to the client.
False Starts
With this new feature implemented, I had to find people to populate the histogram with their own attempts. I enlisted the help of other computer science majors at my university, who provided a good initial dataset. I also received some help from a more experienced Firebase user, who helped me establish a ruleset that was more strict than the very dangerous default:
{
  "rules": {
    ".read": true,
    ".write": true
  }
}
All in all, this beta test with fellow students was a successful test of the new feature. People seemed to enjoy it and I was able to get a good idea of how the data would look. Then, I turned to Hacker News to reach a larger audience (and hopefully reach the front page). I posted the project as a Show HN, but it didn’t achieve the success I had hoped for. What I did learn, however, was the importance of supporting mobile devices, since 3 of the 5 comments complained about the lack of mobile support. Up until now, I was satisfied with the 100 or so data points I was able to collect.
r/InternetIsBeautiful
A friend of mine, who I had been discussing these botched launches with, kindly volunteered to add mobile support to the project through a pull request. With his help, I was ready to launch the project—for the third time. The next place I turned to for users was the subreddit r/InternetIsBeautiful, which tends to enjoy small challenges like the one I had built.
2:19 PM - I hit the submit button on the post, knowing this would likely be my last attempt at launching the project. Not too long after that, I saw the first inklings of growth on the upvote count and number of comments. People began sharing their times under the post and discussing the mental strategies they used to estimate the passage of time:
Ha cool experiment, I lucked out and got exactly 60, so I guess the MISSISSIPPI does work! Although instead of counting all the way up to 60 Mississippi, I did 3 intervals of up to 20 knowing the bigger numbers would throw off the timing because they take longer to say - /u/Murfdigidy
3:40 PM - As I monitored the database, there was a consistent flow of data streaming in, accompanied by the upvote count and comment count rising. I had a feeling that this was only the beginning, and I messaged my friend from earlier about the project’s success.
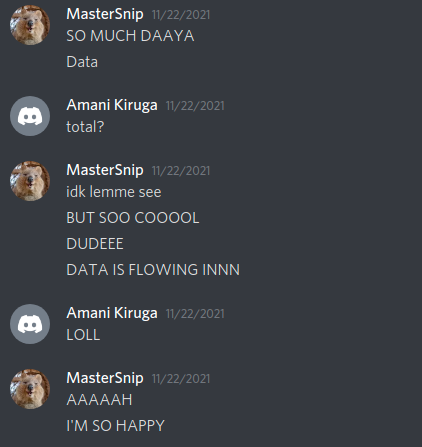
A Discord log of me (MasterSnip) overjoyed by the influx of data
5:08 PM - Soon enough, the large amounts of data revealed a major flaw in my original implementation. I mentioned earlier how the entire list of data was being sent to the client, which means as more people used the app, the list would grow. The Firebase graph quickly showed how inefficient of a design that was:
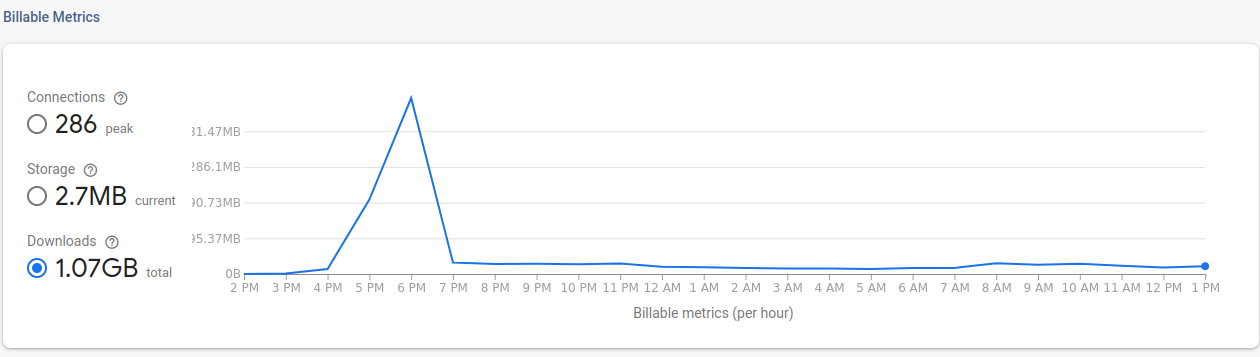
A graph of the project’s Firebase download usage over time
Left unaddressed, the graph above would have looked more like an exponential graph than a spike and dip. By 5:37 PM, I pushed a quick fix to the issue by freezing the data being sent to the client, thereby halting the rapid growth in data consumption.
6:58 PM - I began to search for more ways I could foster virality and encourage more people to limit-test my project. The most obvious option was to add a few basic social media sharing buttons that allowed people to challenge their friends to a time-estimation duel.

Social media buttons added to encourage sharing
10:40 PM - My last addition before heading to bed was a futile attempt at preventing spam: ReCAPTCHA integration. Firebase has built-in support for adding a captcha to your site through App Check, so it was a simple process of adding in the necessary scripts to get request validation working. It wasn’t the best way to prevent spam, but it was a good start. And so after one last refresh of the histogram data, I went to sleep.
Nov. 23, The Next Day
8:00 AM - Inhale, I checked Firebase to see if the data was still there. Exhale—it was, and the database had almost 50,000 entries. I checked Twitter to see if anyone had used the sharing button, and to my surprise, there were many. In fact, the project had garnered some attention from a popular user in the Middle East, with over 500 likes.
The rest of the day was a combination of responding to the latest comments on Reddit and checking to make sure the database wouldn’t surprise me with an exorbitant Firebase bill. Thankfully, most of the chaos was over and I enjoyed the rest of the day seeing people’s natural reaction to the project.
Reflection
Compared to my other projects, this one was a technical cakewalk. The real challenge came from learning how to scale it from a small tens of users to thousands, which introduced many problems I had never faced before. There was a constant struggle between keeping the site afloat and making sure I didn’t have to pay a lot in server costs. Nevertheless, the hundreds of positive comments and thousands of attempts are an addictive high that I hope to achieve again, whenever that may be.
If you’re still curious about how well you can estimate a minute yourself, check out Just a Minute and see how you do.